Header Information: Number of Attempts and Test Data
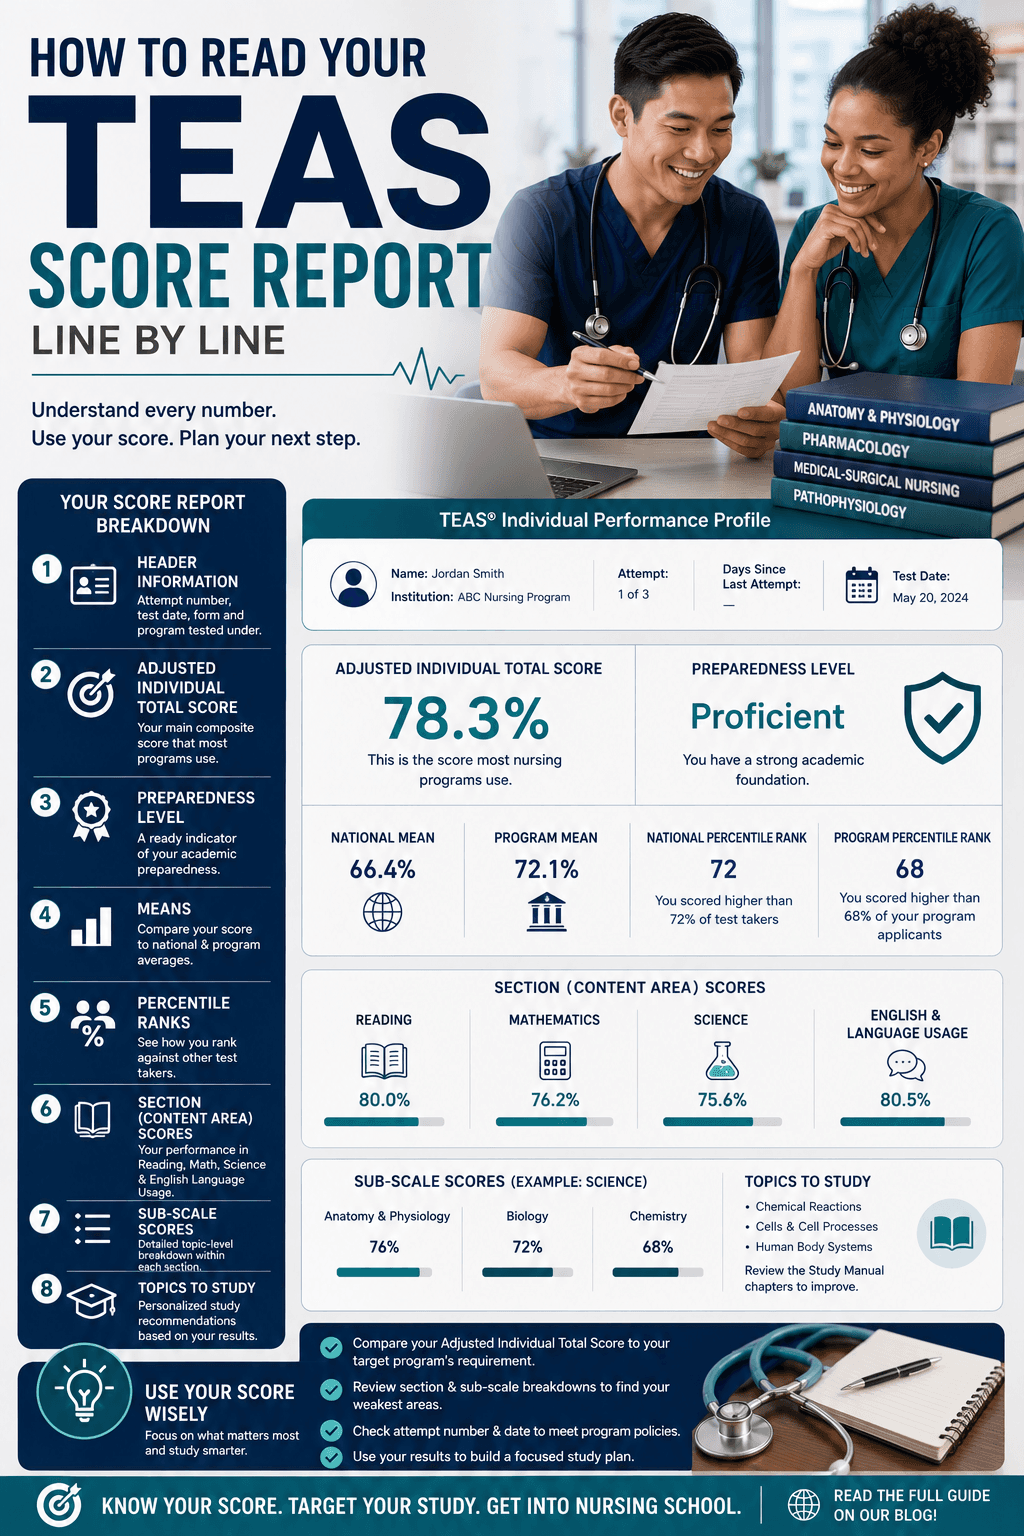
Your report will normally begin with your identifying information: your name, the institution or program you registered under, the test form, and most crucially, your attempt number and number of days since your last attempt if applicable. This section is more important than it looks. Many nursing programs have specific regulations regarding which try they will accept (usually your first attempt, or your most recent attempt within a given window) and some have minimum waiting periods between attempts. If you are submitting this report as part of an application, be sure that the attempt number and date correspond to what your target program specifies before you submit it.
Individual Total Score (Adjusted)
This is usually the most crucial number in the whole report, and the one you’ll most often see front and center. It’s your composite score across the four content areas, statistically adjusted (equated) to allow for minor variations in the relative difficulty levels of the several test forms pulled from the exam’s question pool. Most nursing programs directly reference this number in their stated minimum score requirements, so it’s the one you’ll want to pay the closest attention to.
This is not the same as a raw percentage of questions you got right — because of the equating process done behind the scenes, your Adjusted Individual Total Score may not match up with a percentage you compute yourself based on your own tally of correct answers.
Preparedness Level
Below or next to your Adjusted Individual Total Score you will often notice a qualitative category, sometimes referred to as your ATI Academic Preparedness Level (for example, “Basic,” “Proficient,” “Advanced,” or similar names). What this does is to convert your numeric score into a general readiness band, compared to a larger population of test takers.
This is helpful context, not a final judgment. If you earn a “Proficient” rating, it doesn’t indicate you’ve met the criterion for your particular target program. Each program has its own numeric requirements, independent of these basic bands. Don’t rely on only the qualitative label; always check your real percentage against the minimum your program publishes.
Program Mean vs. National Mean
These two statistics reflect the average Adjusted Individual Total Score among two different comparison groups: all test-takers nationally, and particularly the applicant pool for the program or institution you tested under, if such data is available. These figures are benchmarks, not part of your personal score, but they really do help set expectations right. If your score is far below the program mean at your chosen school, that's a signal worth examining carefully even if you've officially met the minimum requirement, since it means you're on the lower end of that program's real applicant pool.
Program Percentile Rank and National Percentile Rank
These numbers tell you how you compare to all the other people who have taken the test . The score is a percentile, not a simple percentage. For example, a National Percentile Rank of 65 signifies your result was higher than 65 percent of test takers nationwide. The Program Percentile Rank is the same calculation, except that it compares you to other applicants to your specific program, if that data is tracked.
Note that percentile rank and percentage-correct are two different statistics measuring two different things; don’t confuse a percentile rank of, say, 50 with a score of 50%. They are calculated separately and should not be read as interchangeable.
Content Area (Section) Scores
Your report shows results for the four individual curriculum areas within the Overall Composite: Reading, Mathematics, Science and English and Language Usage. Similarly, each section score is adjusted to account for probable variances in the difficulty of form in that particular segment, just as you do with your overall score.
This breakdown is one of the most actionable aspects of the report. If your overall score falls short of your aim, this part tells you exactly which subject area is bringing your composite down, which is considerably more valuable for planning a retake than looking at the total score alone. Some programs additionally establish separate minimums for specific areas in addition to an overall composite requirement, so check this breakdown against your intended program's stated criteria even if your total score looks great.
Sub-Scale Scores
Within each of the four primary subject sections, your report often goes down further into specific sub-topics. For example, Science might split into sub-areas like anatomy and physiology, biology and chemistry. Reading might split into categories like main concepts and details or craft and structure. These granular sub-scale scores are sometimes the most exact diagnostic information in the whole report because they identify individual knowledge deficiencies rather than just labeling an entire area as inadequate.
Topics to Study
Many score reports have a special part that lists the exact study manual chapters or subjects that pertain to your lower sub-scale categories. This is essentially a tailored starting point for retake preparation, built directly from your performance data rather than a generic study plan. If you are planning to retest, this section should be one of the first things you examine when constructing your updated study program.
Helpful hints to understand your report
- First, look for your Adjusted Individual Total Score, as this is the number that most programs will actually utilize. Compare this score with the published criterion for the particular program to which you are applying, rather than thinking that a label of “Proficient” is inherently good enough.
- Instead of restudying everything broadly, focus on the content area and sub-scale breakdowns for retake prep. These sections inform you just where to focus.
- Before you submit your report to an admissions office, be sure you carefully check the attempt number and date fields, since schools usually have specific policies concerning which attempt or how recent a score they would accept.
- Don’t over-index on percentile rank when judging your preparation. A percentile rank tells you how you compare to other test-takers, but your program's actual necessary Adjusted Individual Total Score is what determines whether you satisfy their exact admissions bar.
Summary
A TEAS score report contains more information than most test-takers initially think, and knowing which numbers count for admissions choices and which are just for context is critical to how you interpret your results. Focus first on your Adjusted Individual Total Score versus your target program's criteria, then use the content area and sub-scale breakdowns to lead any further preparation, and you'll receive far more practical value out of your report than a fast check at the top-line figure alone.