GED Social Studies: How to Read Maps and Interpret Data
The GED Social Studies test requires students to understand information presented in different formats. Along with written passages, you may encounter maps, graphs, charts, and tables. These materials can present historical, geographic, economic, or civic information. Learning how to interpret them can help you identify patterns and answer questions using evidence.
1. Start With the Title
Before examining a map, chart, or table, read its title. The title usually tells you what the information is about. A map might show population distribution, while a chart might compare unemployment rates across several years. Understanding the topic first can help you interpret the details correctly.
2. Read the Map Legend
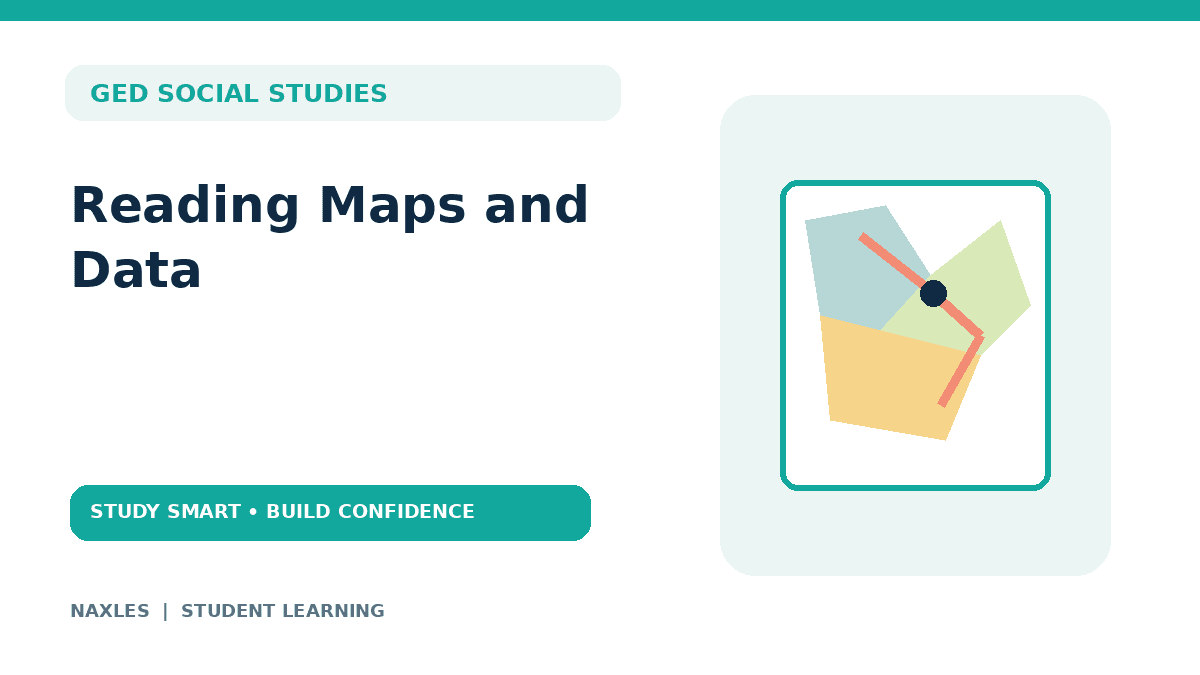
A map legend explains the symbols, colors, or patterns used on the map. For example, different colors might represent different population ranges. Lines might represent roads, rivers, or political boundaries. Do not assume that a color or symbol has a universal meaning. Always check the legend provided with the map.
3. Check the Scale and Direction
A map scale shows the relationship between distance on the map and actual distance on the ground. For example, a scale might indicate that one centimeter represents 10 kilometers. You can use that relationship to estimate the actual distance between locations. Also check the compass or directional indicator, if provided. It can help you identify north, south, east, and west.
4. Read Charts and Graphs Carefully
Charts and graphs summarize information visually. A bar graph may compare quantities across different categories. A line graph may show how something changes over time. A table may provide exact values for comparison. Before answering a question, check the labels, units, and scale. A graph showing percentages should not be interpreted in the same way as one showing total numbers.
5. Compare Information
Some questions require you to compare two or more locations, time periods, or groups. For example, a table might show population figures for several cities. A question could ask which city has the largest population or how much the population differs between two cities. Read the values carefully and make sure you compare the correct rows or columns.
6. Identify Patterns and Changes
Maps and data can reveal patterns, such as population growth, changes in trade, or differences between regions. When interpreting a pattern, pay attention to the time period and the population represented. For example, a chart showing an increase over five years does not necessarily tell you why the increase occurred. The data may show a trend without explaining its cause.
7. Use Evidence to Answer Questions
Choose answers based on the information presented rather than assumptions about the topic. If a map shows that one region has a higher population density, you can identify that difference from the map. However, you should not assume the map explains why the region is more densely populated unless the source provides that information. When a question asks you to draw a conclusion, make sure the conclusion is supported by the data.
How to Practice Reading Maps and Data
Practice with maps, historical timelines, tables, and charts. Start by describing what each visual shows. Then answer questions about its labels, comparisons, patterns, and limitations. When you get a question wrong, check whether you misread the legend, overlooked a unit, or made a conclusion that went beyond the information provided.
Final Thoughts
Reading maps and data is a skill that improves with practice. Start with the title, examine the labels and legend, and identify what the visual actually shows. Use the evidence provided to answer questions, and avoid assuming that a pattern automatically explains its cause.