GED Math: Understanding Slope and Graphs
Graphs can communicate mathematical relationships quickly. For GED Mathematical Reasoning preparation, understanding slope can help you interpret how one quantity changes in relation to another.
What Is Slope?
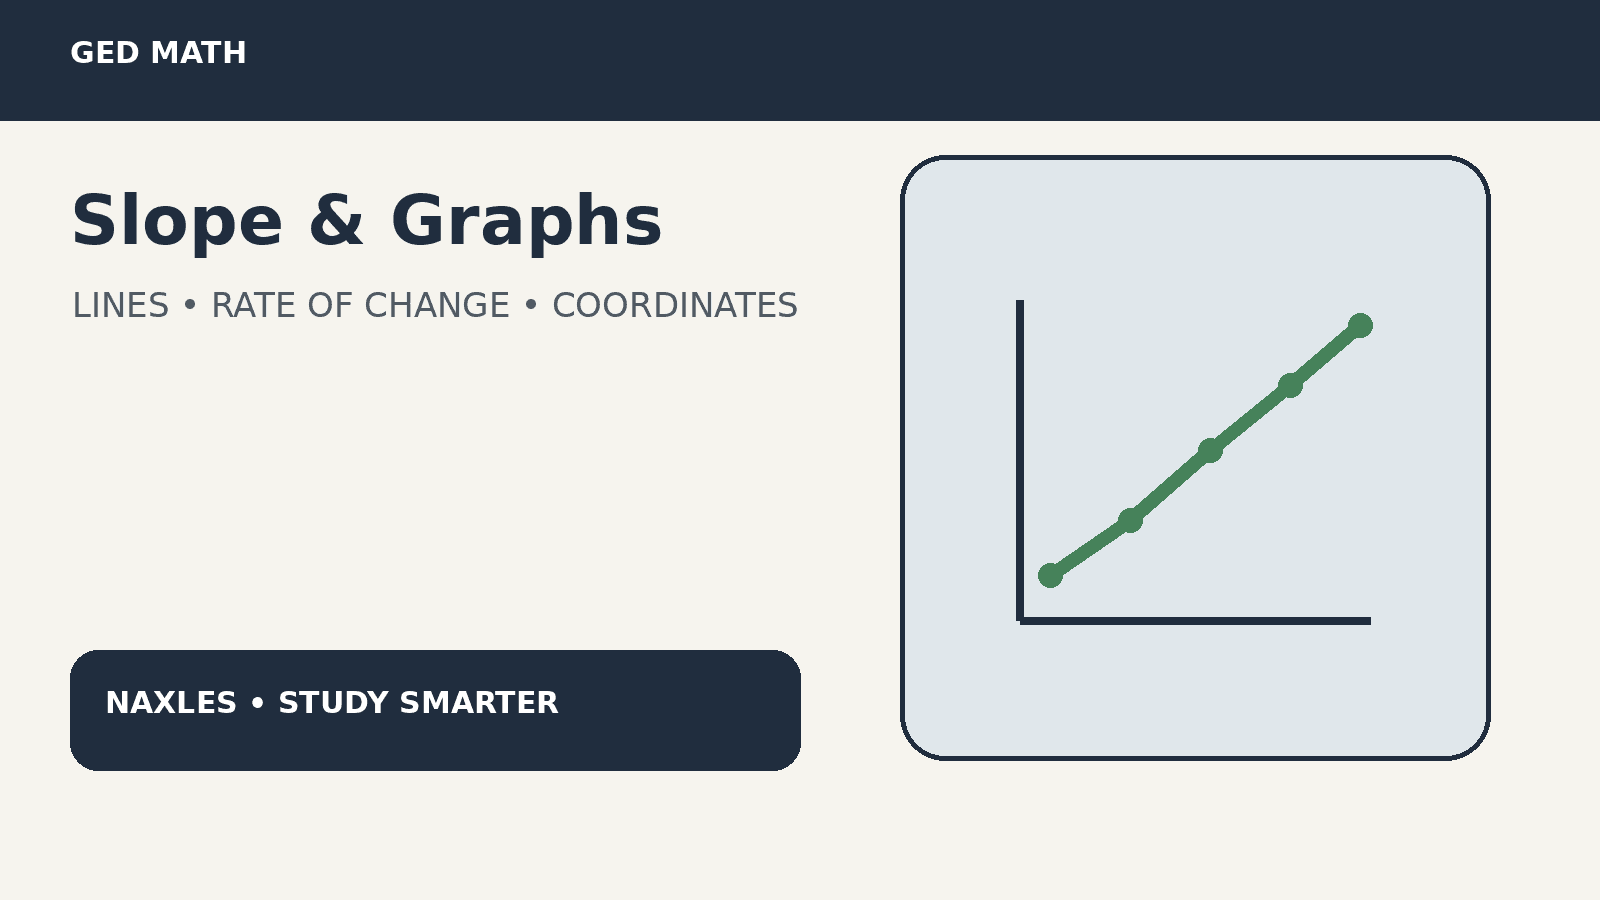
Slope describes the rate at which a line rises or falls. The basic formula is: Slope = rise ÷ run Using coordinates, this can also be written as: m = (y₂ − y₁) ÷ (x₂ − x₁)
Positive and Negative Slope
A line with a positive slope generally rises from left to right. A line with a negative slope generally falls from left to right. A horizontal line has a slope of zero.
Example
Consider two points: (2, 3) and (6, 11) The change in y is: 11 − 3 = 8 The change in x is: 6 − 2 = 4 Therefore: 8 ÷ 4 = 2 The slope is 2.
Slope as Rate of Change
Slope can represent a real-world rate. For example, suppose a graph shows that a vehicle travels 120 miles in 3 hours. The rate is: 120 ÷ 3 = 40 miles per hour Thinking about slope as a rate can make word problems easier to understand.
Read the Axes Carefully
Before interpreting a graph, identify:
- What the x-axis represents
- What the y-axis represents
- The units
- The scale
- The values of important points
A graph can be misleading if you ignore its scale.
Practice With Different Graphs
Don't practice only straight lines. Learn to interpret tables, coordinate graphs, and real-world relationships.
Final Takeaway
Slope is essentially a way to describe change. Practice calculating it from coordinates and interpreting what it means in a real-world situation.