GED Science: How to Read Graphs and Understand Experiments
The GED Science test assesses more than your knowledge of scientific facts. It also requires you to interpret information, understand experiments, and draw conclusions from evidence. Graphs, tables, and descriptions of scientific investigations are common ways of presenting that information. Learning how to interpret these materials can help you approach science questions more confidently. The goal is to understand what the data shows rather than simply memorize scientific terms.
1. Understand the Purpose of an Experiment
An experiment is a structured way of investigating a question. It usually begins with a research question or hypothesis. For example, a researcher might ask whether plants grow taller when they receive more sunlight. The researcher can then design an experiment to compare plant growth under different amounts of sunlight. When reading an experiment description, identify:
- What question is being investigated?
- What is the researcher changing?
- What is being measured?
- What conditions are kept the same?
Understanding these details helps you follow the experiment and evaluate its results.
2. Learn the Three Main Types of Variables
Variables are factors that can change during an experiment. Independent variable: The factor the researcher deliberately changes. In the plant example, this could be the amount of sunlight. Dependent variable: The factor the researcher measures. In the example, it could be the height of the plants. Controlled variables: Conditions kept the same to make the comparison fair. These might include the plant species, soil type, amount of water, and container size. A useful way to remember the difference is that the independent variable is changed, while the dependent variable is measured.
3. Read the Graph Title and Labels
Before examining the data, read the graph title. It usually describes what is being compared or measured. Next, examine the horizontal and vertical axes. The horizontal axis often shows the independent variable, while the vertical axis often shows the dependent variable. However, always check the actual labels instead of assuming. Pay attention to the units. A graph showing plant height in centimeters is different from one showing height in inches. Also, look at the scale. If the vertical axis increases by 5 units at each interval, the difference between two points may be larger than it first appears.
4. Identify Patterns in the Data
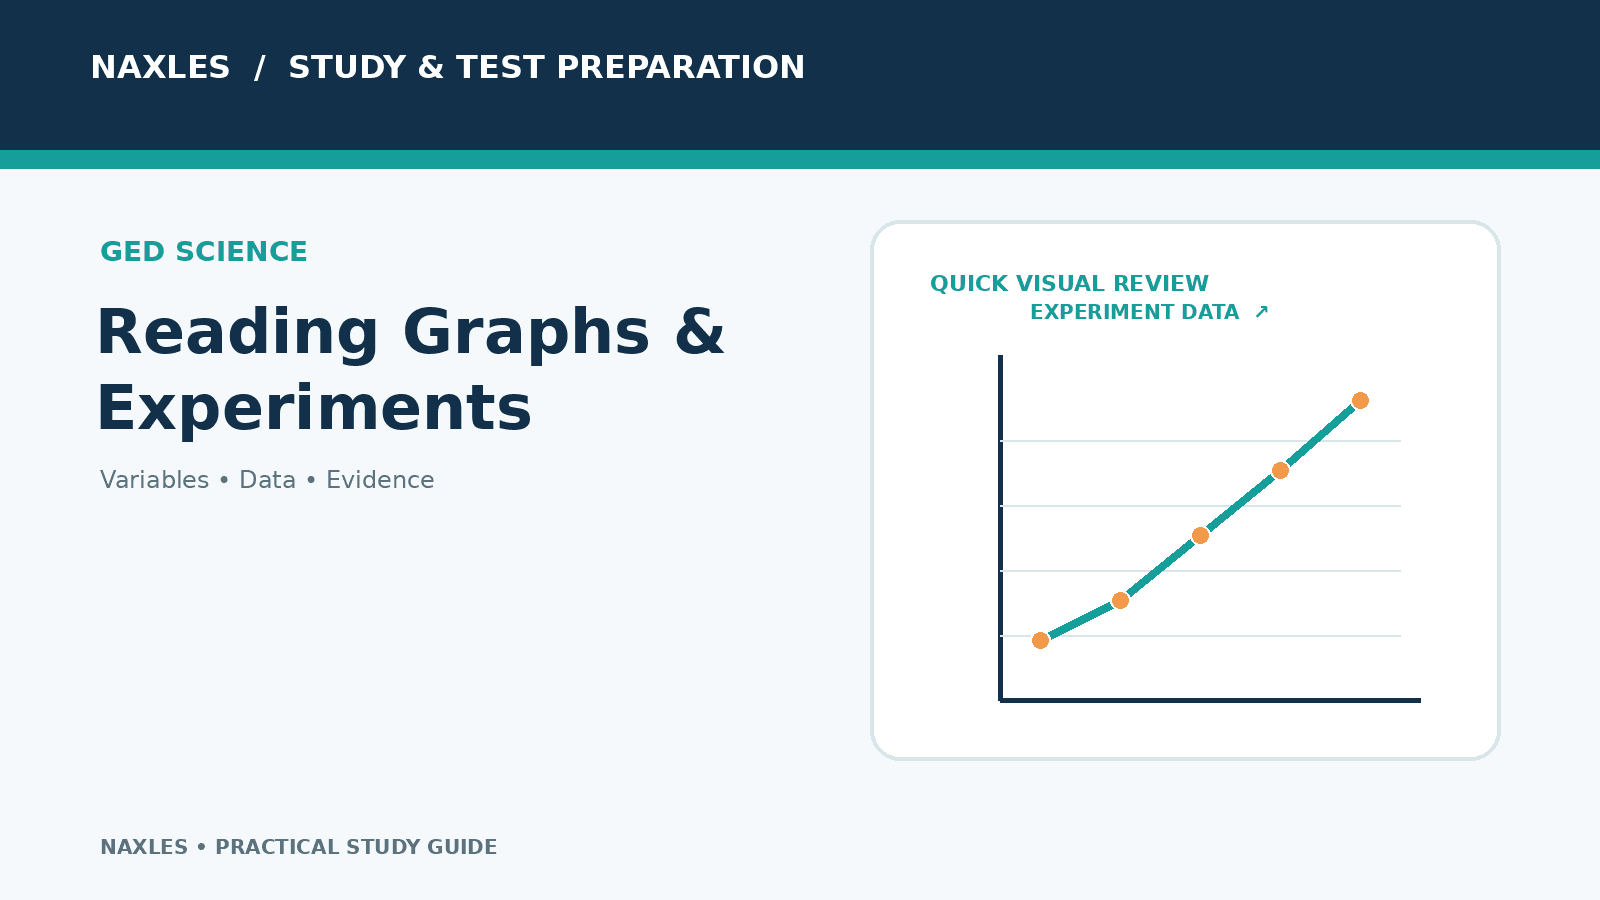
Graphs can show increases, decreases, similarities, and differences. For example, imagine a graph showing that plants receiving 2, 4, and 6 hours of sunlight grow progressively taller. This suggests that plant height increased as sunlight exposure increased in that experiment. However, do not assume that the same relationship will continue indefinitely. The data only supports conclusions within the conditions and range that were tested.
5. Draw Conclusions Using Evidence
A scientific conclusion should be based on the experiment's results. Suppose a researcher compares two groups of plants. One group receives a certain amount of fertilizer, while the other receives none. If the fertilized plants grow taller, the results may support the hypothesis that fertilizer affected growth under the conditions tested. When answering a question, choose a conclusion that matches the evidence. Avoid making claims that the experiment did not investigate.
6. Practice with Tables and Sample Questions
Graphs are not the only way scientific information is presented. You may also encounter tables, written procedures, and descriptions of observations. Practice reading the information carefully and answering questions such as:
- Which group had the highest measurement?
- What changed during the experiment?
- What was measured?
- Which conclusion is supported by the data?
- What additional information would help explain the results?
The official GED Science overview includes information about experimental design, interpreting graphs, and using scientific data.
Final Thoughts
You do not need to memorize every scientific detail to work through graph and experiment questions. Focus on understanding the research question, identifying variables, reading labels, and using the evidence provided. Regular practice with graphs and tables can help you develop these skills.